DrugMatch-Confidence
Choosing which preclinical drug-response experiments to run next
v1.1.0.dev0 · Evidence review View repository
The decision
Which cancer cell lines should a laboratory test first, and does a complex model improve that choice over a simpler one?
DrugMatch combines DepMap molecular profiles with PRISM drug-response measurements. The current review establishes a matched comparison across five drugs, separates calibration from fitting, and makes unsupported decisions visible. Its useful present output is experimental ranking.
For each supported drug, the tool returns a continuous response prediction, a calibrated probability for the response extremes, an uncertainty interval, SHAP explanations and input-support warnings. A separate policy returns sensitive, resistant or abstain, with reasons. The five review bundles remain unreviewed and therefore abstain from categorical screening decisions.
A comparison that can detect failure
XGBoost, ElasticNet and lineage-only baselines see the same five evaluation folds. Each held-out cell line is predicted without using its response to fit the model. Feature selection, response cutoffs and calibration remain local to the appropriate training subsets.
The outer and inner split allocation uses full-cohort outcome-rank quartiles for stratification. This is retrospective outcome-stratified evaluation, not an outcome-blind prospective experiment.
| Drug | XGBoost AUROC | ElasticNet AUROC | Lineage AUROC |
|---|---|---|---|
| Trametinib | 0.848 | 0.863 | 0.755 |
| Afatinib | 0.905 | 0.916 | 0.774 |
| Palbociclib | 0.722 | 0.726 | 0.561 |
| Olaparib | 0.606 | 0.575 | 0.493 |
| Gemcitabine | 0.506 | 0.609 | 0.592 |
AUROC measures how well the model ranks sensitive versus resistant response extremes: 0.5 is chance-level ranking. It is different from drug-response AUC, where a lower value indicates greater sensitivity.
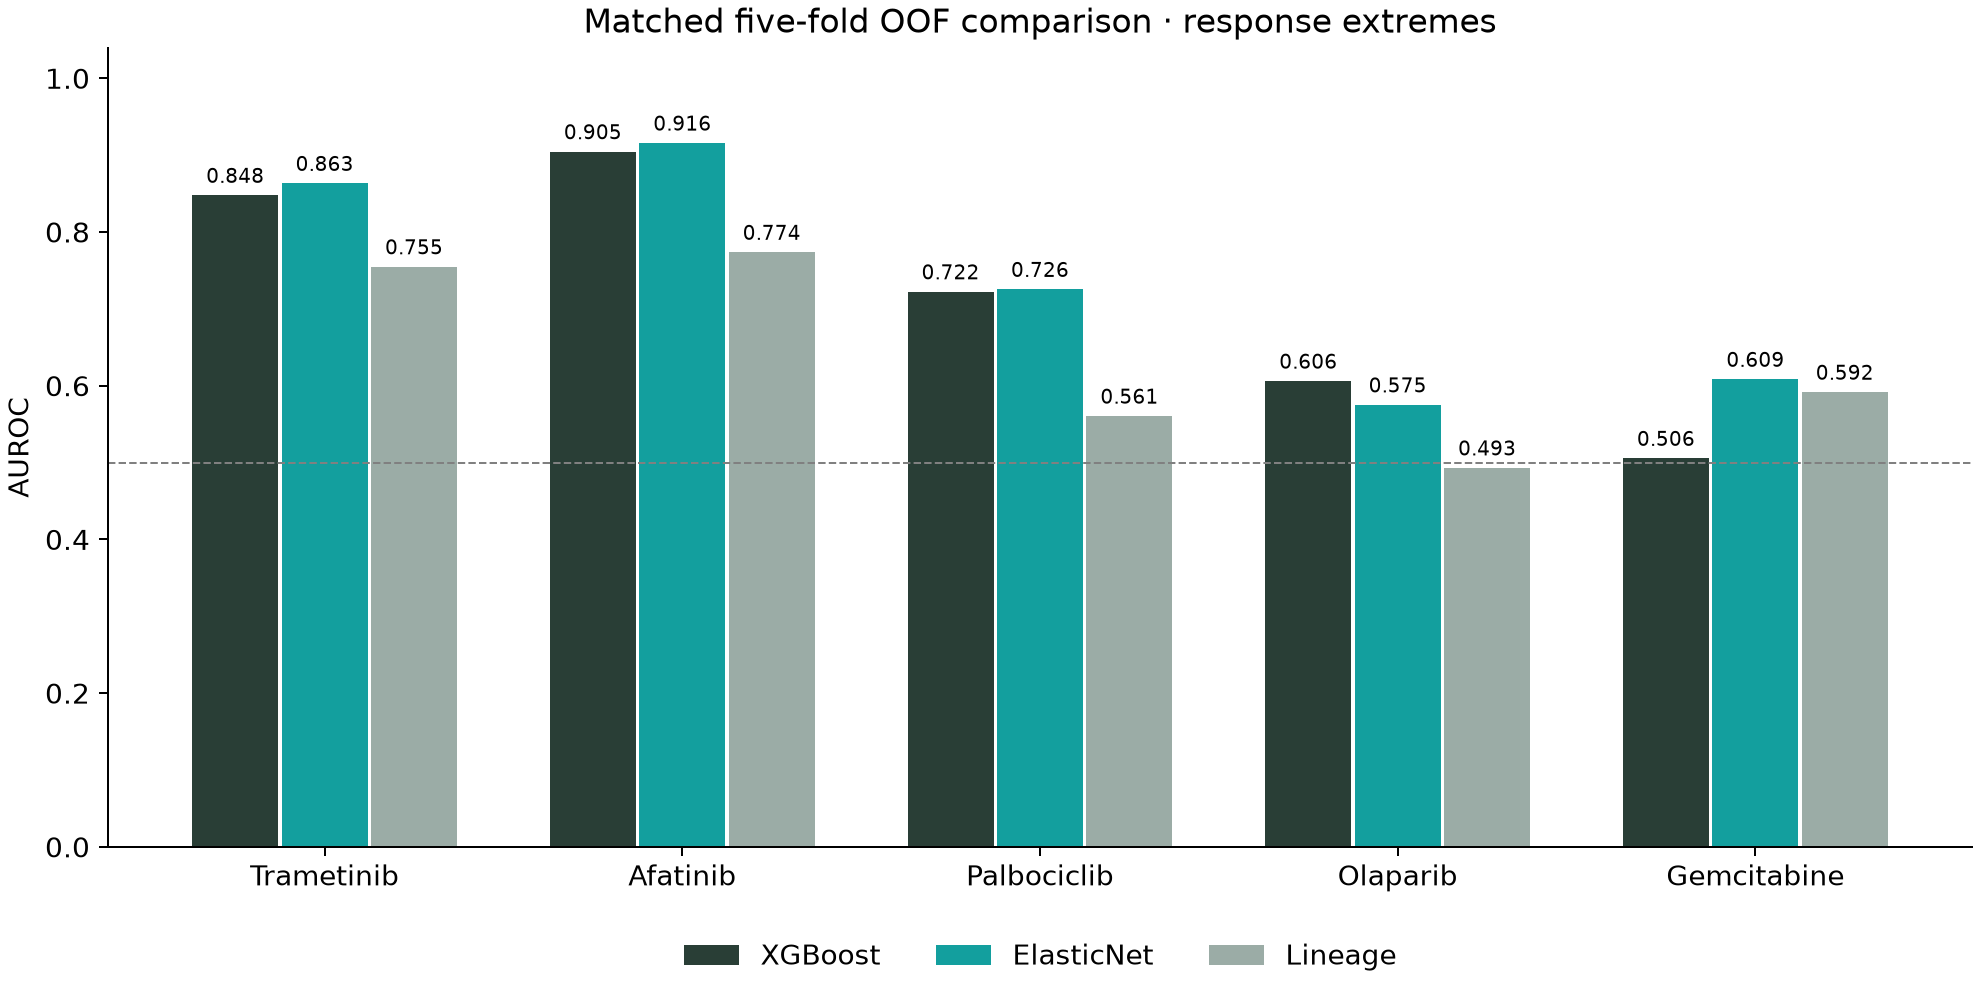
There is no demonstrated XGBoost advantage over ElasticNet. For gemcitabine, complexity measurably hurts in this evaluation: the paired AUROC difference is −0.103, with an unadjusted 95% interval of −0.178 to −0.022. This interval is conditional on the saved predictions; it does not include uncertainty from retraining or correct for multiple comparisons.
MAPK: turning a ranking into an experiment
Among 375 held-out trametinib candidates, the ten highest-ranked models contain:
| Ranking | Sensitive models in the top ten |
|---|---|
| XGBoost | 7 |
| ElasticNet | 7 |
| Lineage only | 5–6, depending on ties; 5.2 expected |
| Random selection | 2.53 expected |
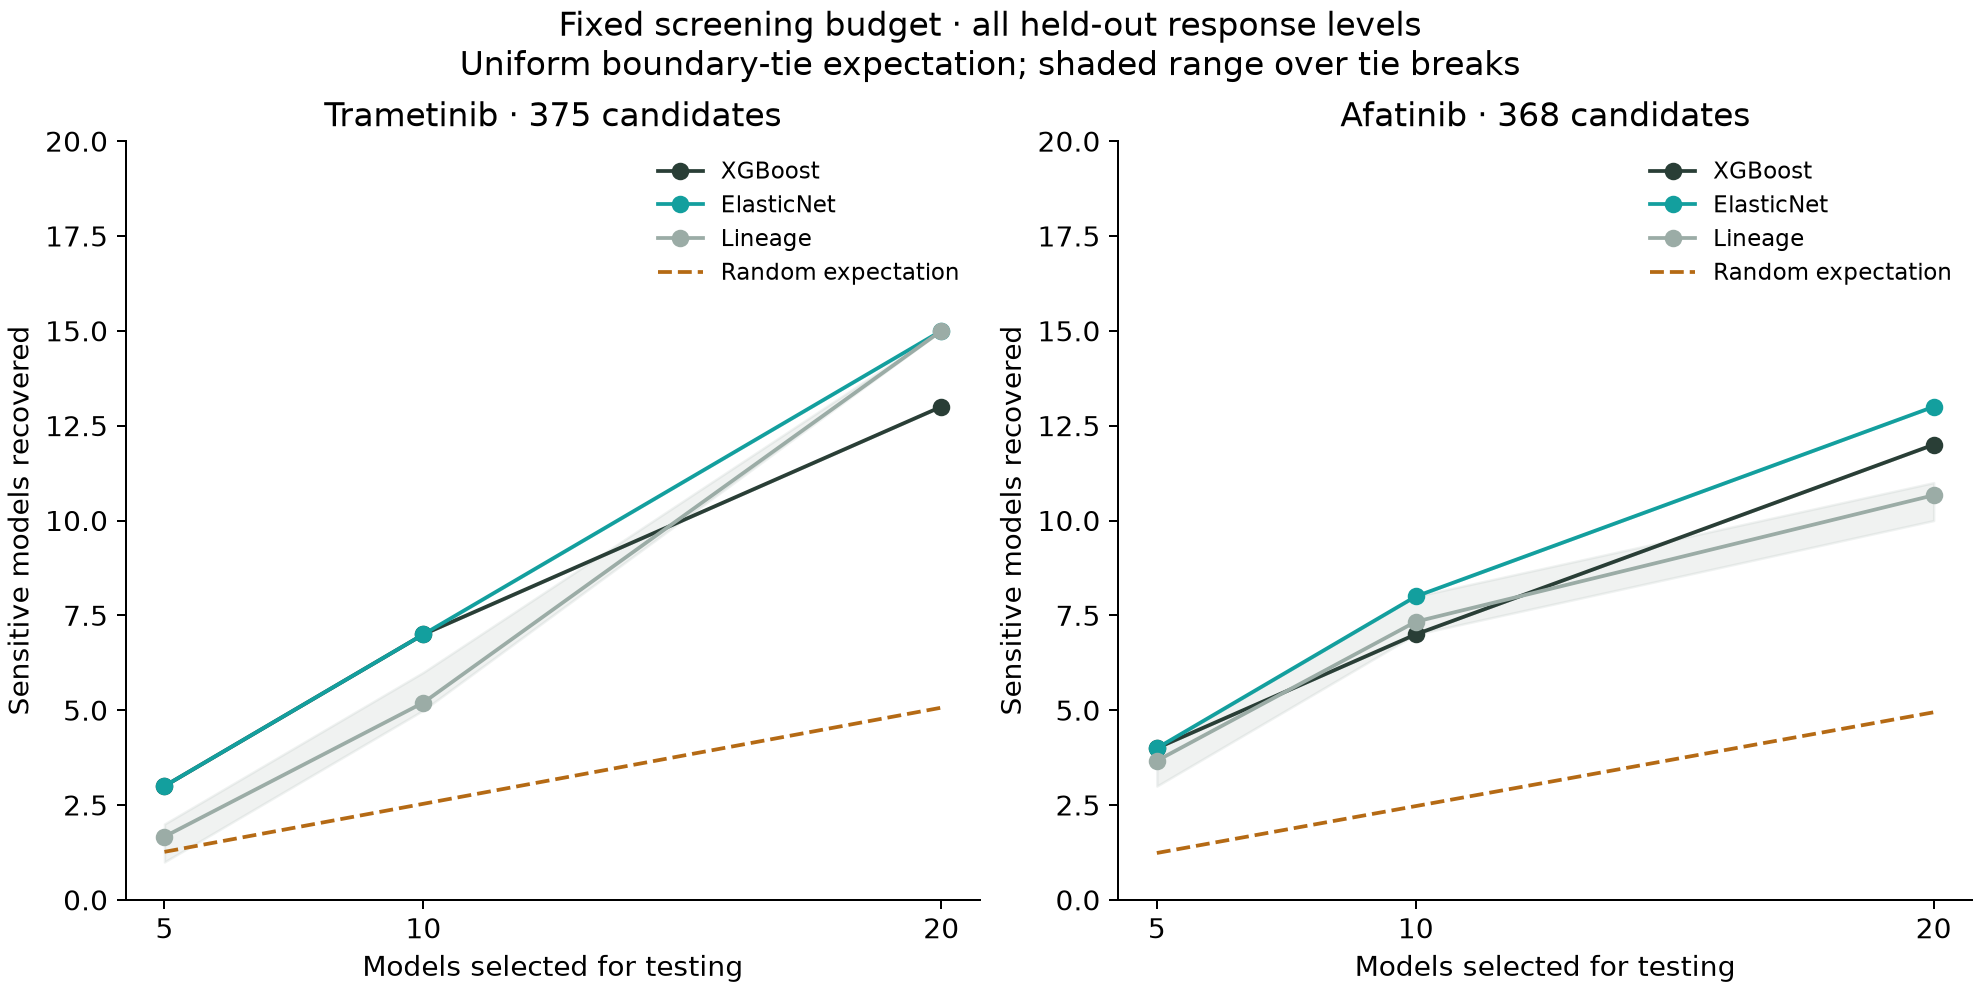
This is retrospective evidence, not an experiment already completed. The proposed MAPK pilot tests six prioritised models, two predicted-resistant controls and two uncertain or discordant cases. Viability, pathway readouts and biological replicates would test whether the ranking is useful in a new experiment.
What uncertainty revealed
The saved trametinib and afatinib predictions provide no categorical support under the strict 90% interval rule. Zero accepted decisions does not establish a useful decision policy.
A feasibility audit instead measures how much the saved interval radius would need to shrink before technical support appears. It is a diagnostic of these predictions, not an estimate of nominal coverage or an isolated measurement of assay noise. The policy was not relaxed after inspecting the results.
Historical v1.0 bundles and GDSC2 results remain in the repository for provenance. They are not validation of the revised matched protocol. SHAP explanations are associations, not causal biomarkers.
Software and evidence
- Python 3.12+, command-line prediction and a Streamlit interface.
- Five review bundles alongside five historical bundles.
- Saved out-of-fold predictions, five reproducible figures and checksum manifests.
- 41 passing tests, lint and type checks, and smoke checks for all ten models.
- Passing GitHub CI, package and Docker checks for the merged review.
The source, results and limitations are documented in the evidence review.
Scientific boundary
This work establishes an evaluation that can reject unnecessary model complexity and identify where categorical decisions lack support. It supports planning the next experiment; it does not establish prospective utility or patient-response prediction. Cell lines do not reproduce the full tumour microenvironment, pharmacokinetics or patient heterogeneity, and the tool cannot predict an unseen compound.
Inspect the matched predictions, uncertainty audit and proposed MAPK experiment.